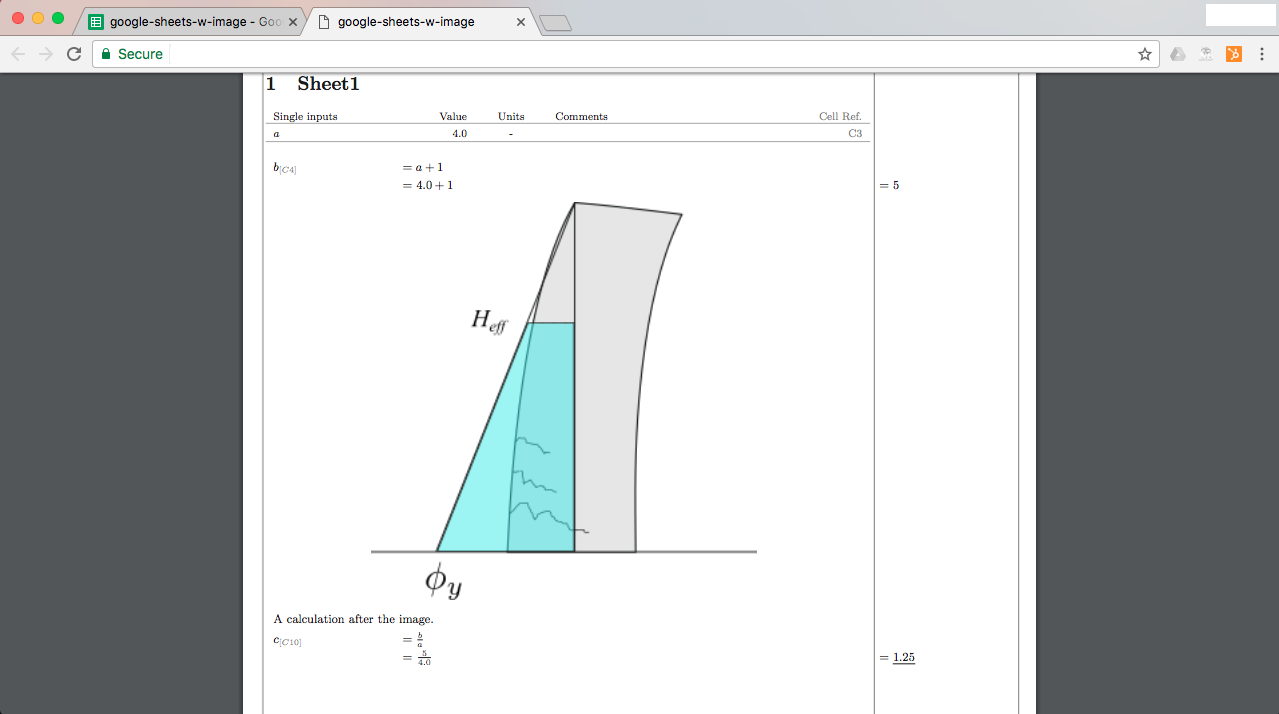
How to include images in Pensolve output - with Google sheets
29 May 2017To include an image into Pensolve output you need to format a border to the image. Unfortunately this is quite tricky in Google Sheets. This is a step-by-step guide on how to get an image to show up.
Important: Only .JPG, .JPEG, .PNG images are supported in the Pensolve output.
Graphs/Charts and other editable images are not supported
You can make a copy of the tutorial file here
1) Open Google sheets
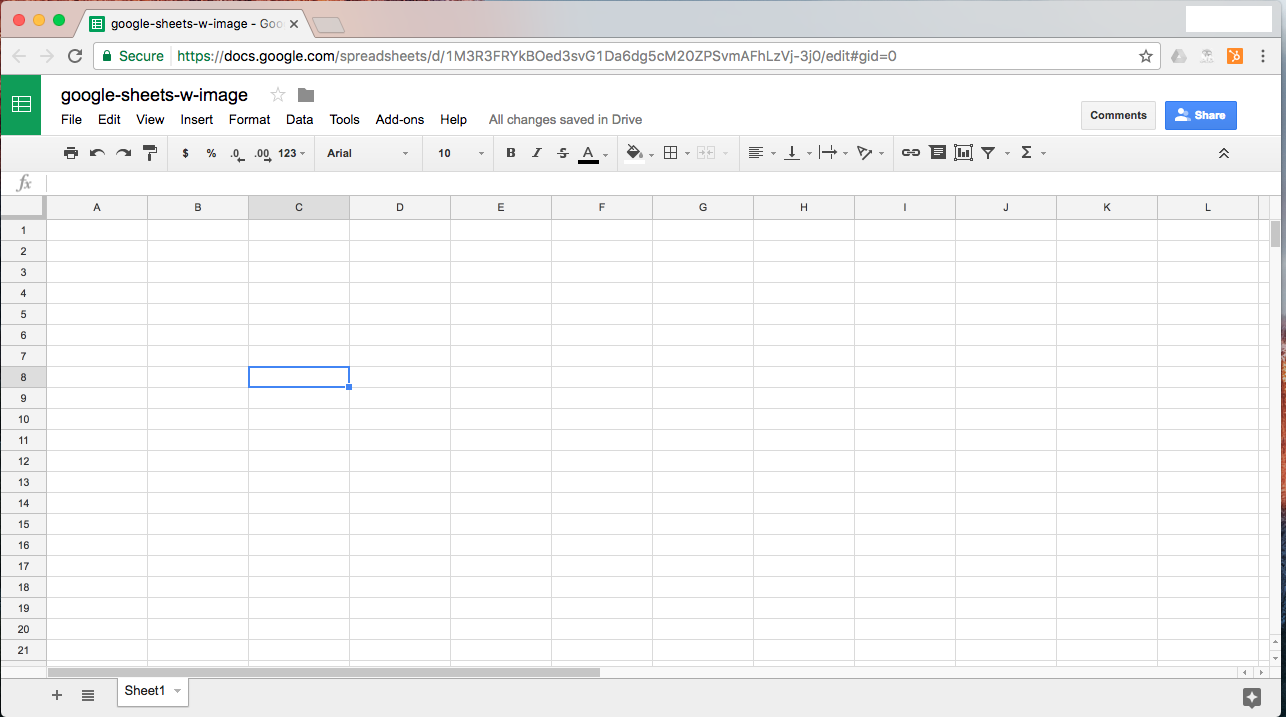
2) Add some calculations and open the Pensolve sidebar add-on
Add-ons>Pensolve>Show sidebar
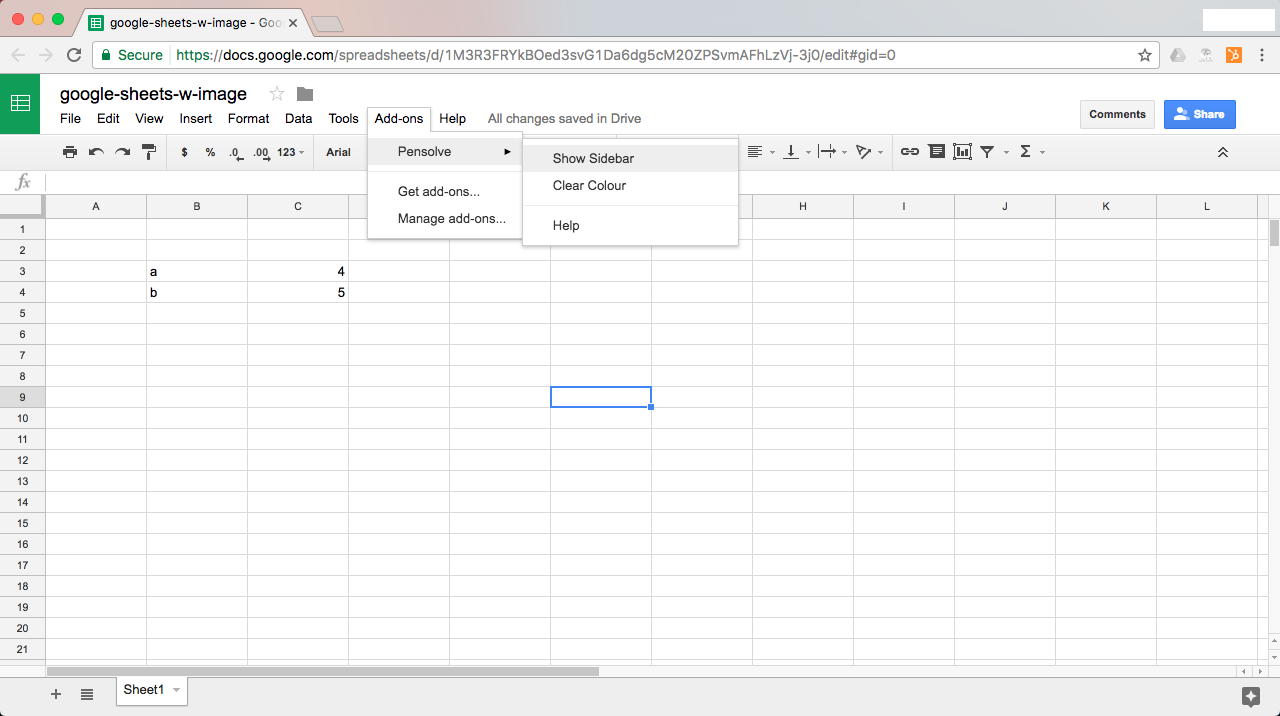
3) Insert a drawing [Not an image, as you can not format an image]
Insert>Drawing…
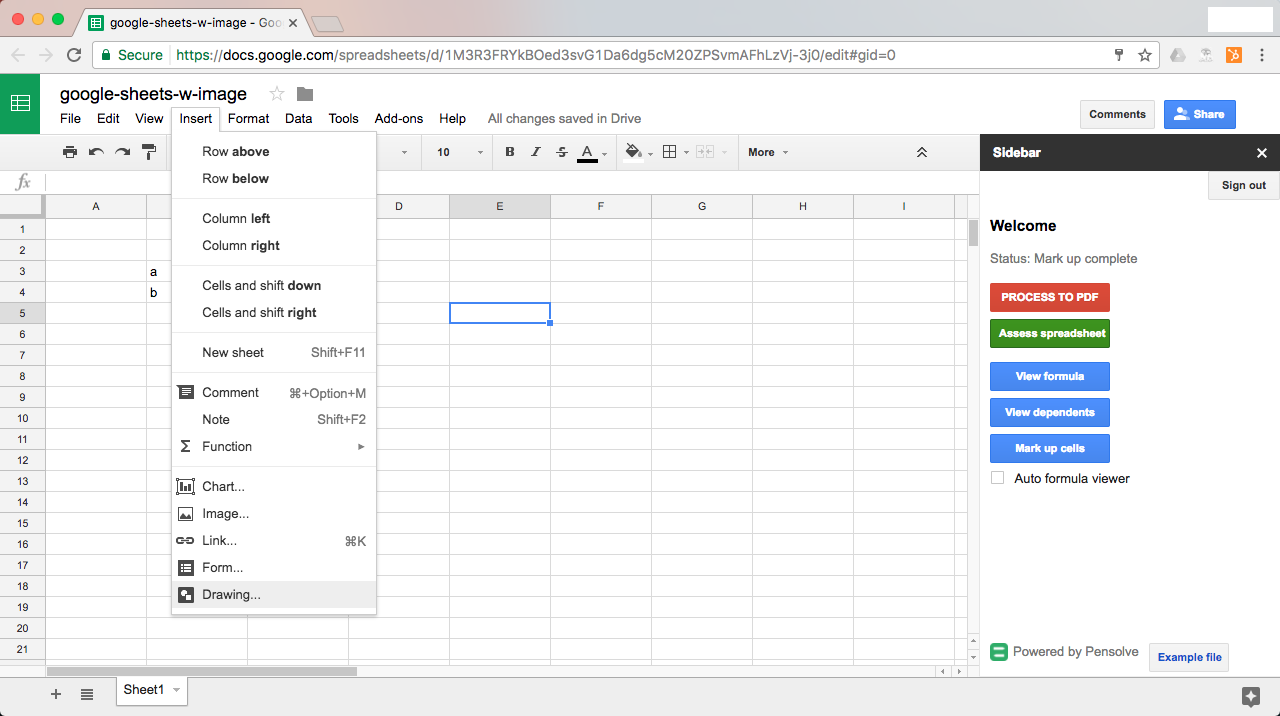
4) Insert an image into the drawing (Remember only .jpg, .jpeg or .png files)
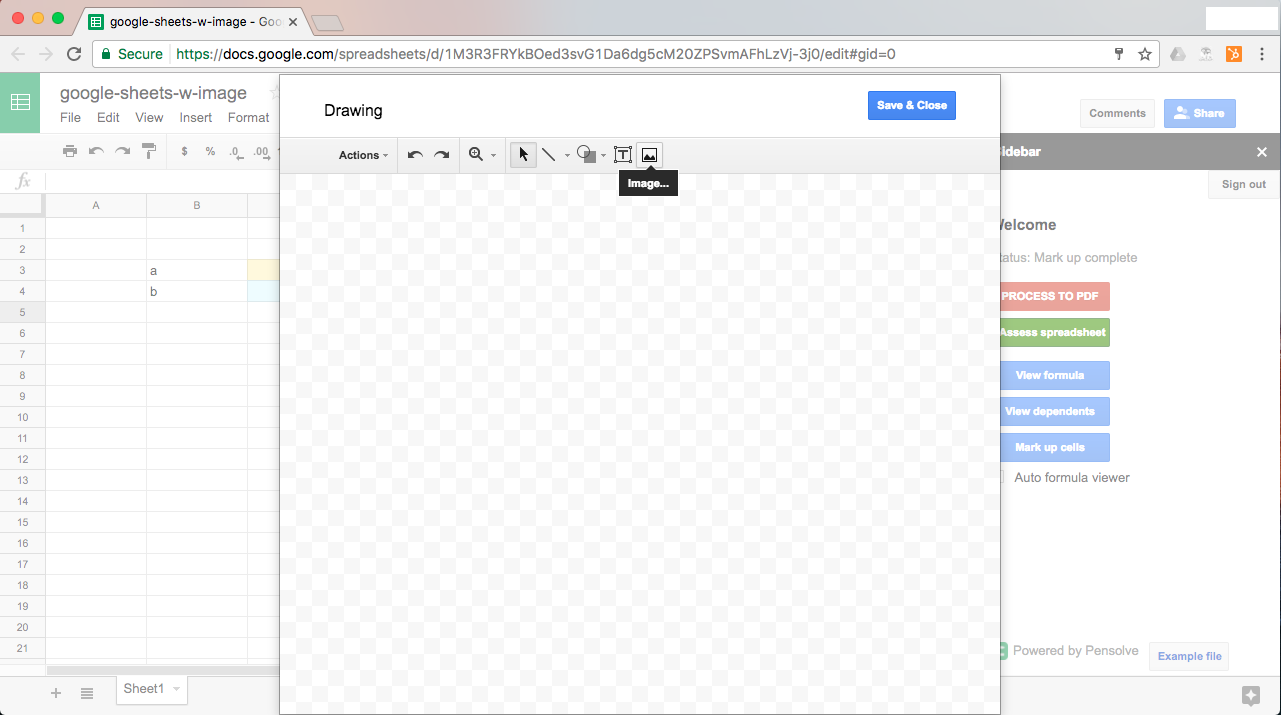
5) Add a border to the image
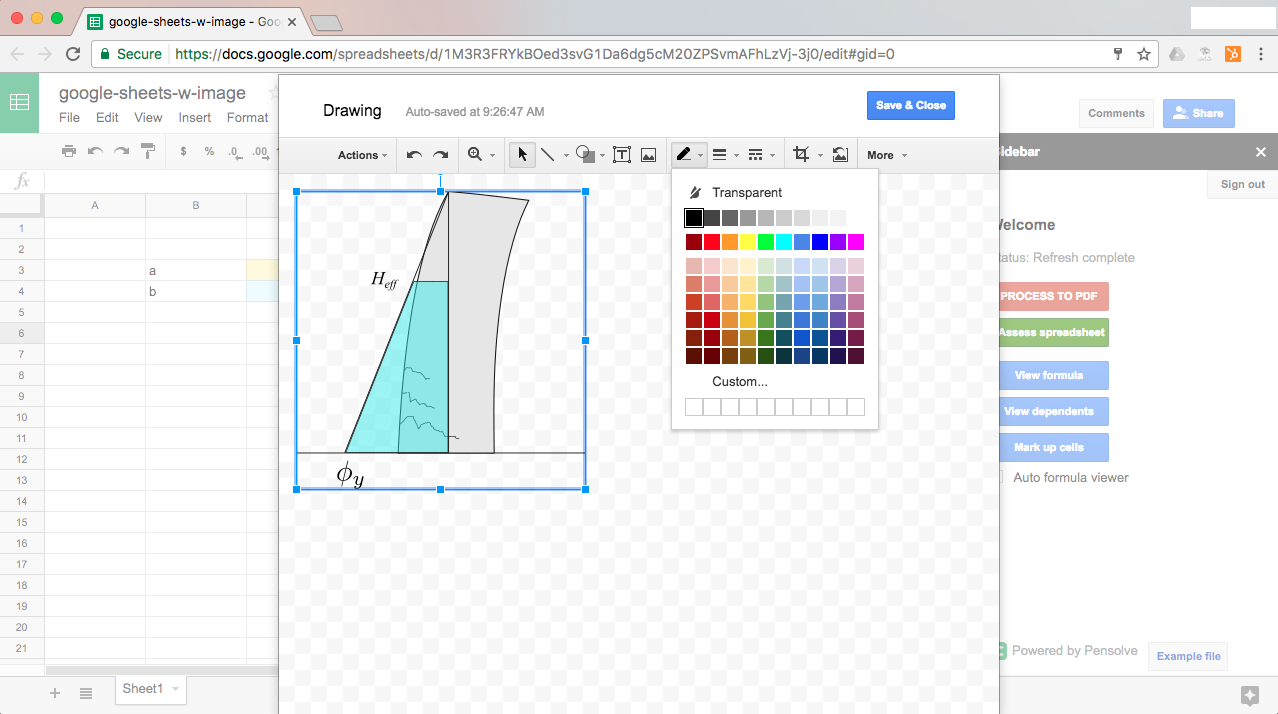
6) Click ‘Save & Close’
Your image should appear in Google Sheets - if it doesn’t you may need to refresh your browser or reopen the Sheets document.
7) Reposition the image
The top-left corner of your image is location where the image will appear in the Pensolve output
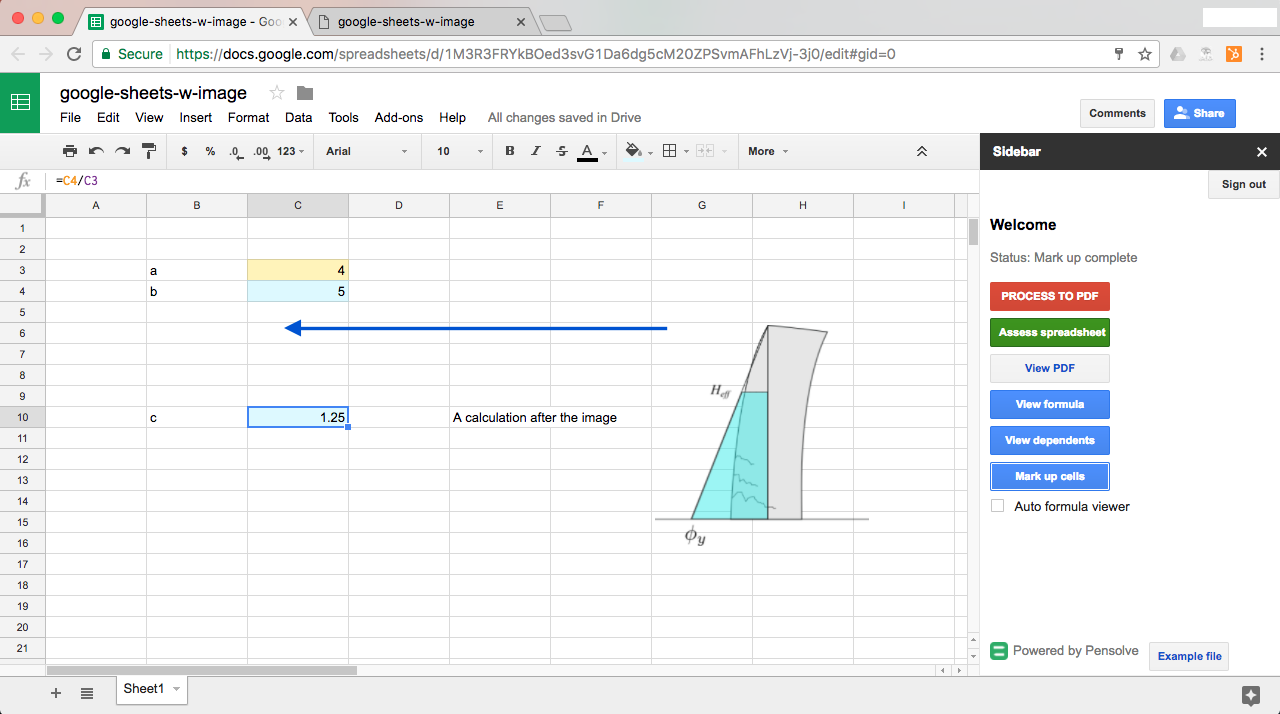
8) Click ‘Process to PDF’ in the Pensolve sidebar
View the PDF to see the image appear in the output in between the calculation lines for parameters ‘b’ and ‘c’.
